In my experience, one of the barriers to successful technology projects is the lack of a clear, consistent and agreed upon financial basis on which the project is undertaken and then measured. Although there have been many improvements in investment planning, more attention is often given to evaluating the technology itself rather than critically assessing and building a comprehensive financial case for its return on investment.
Whether you are:
- A vendor selling your solution to a customer
- A customer building an internal investment case to invest in a solution
- A transformation or project lead responsible for the delivery of the project
It is essential to have a consistent basis by which the project/solution will deliver tangible business benefits. I’ve been involved in thousands of technology decisions and the lack of ROI is very rarely the software but rather down to decision making, communication and a lack of a consistent value/ROI framework that can be tied to the technology decision.
During the early days (day one) I like to start with something really simple. At a subsequent phase we’ll do a much more comprehensive business value assessment but early on I want to be clear on the high level objectives and the language (KPIs) I will want to use during discovery.
Many years ago I built a simple value framework that would ensure I understood the business drivers behind a technology decision. An example of this is below and is a Sales Productivity / Sales Transformation value proposition.
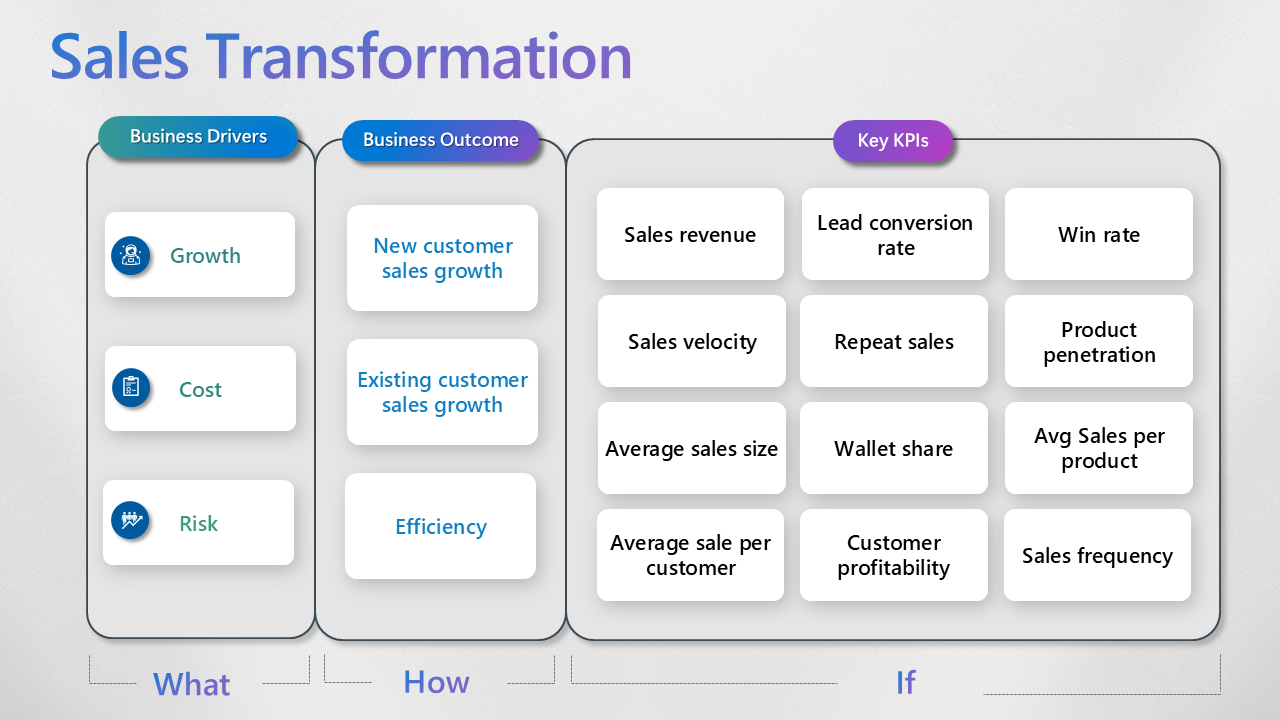
It breaks down into three components:
- Business Drivers – What goal is the organisations trying to achieve?
- Business Outcomes – How are they going to achieve the goal?
- Key Performance Indicators – How will they measure If they are achieving the goal?
Lets go a little deeper:
Business Drivers – What
Firstly, it is crucial to identify the business driver from the customer’s perspective. Generally, this falls into one or more of three categories: growth, cost or risk reduction / mitigation. Understanding whether the customer’s primary focus is on expanding their business or reducing costs is essential, as it influences the source of their budget allocation. Typically, cost budgets are nearly always allocated, whereas discretionary budgets can often come from a growth budget.
For example, while working with a major UK bank, I initially focused on cost reduction due to their financial strain and shareholding by the UK government. However, after realising that there was no budget for cost reduction, we shifted our value proposition towards growth.
This drastically changed the conversation we had and how we “sold” our solution, the language we used, the examples we gave and the people we spoke to.
As a result, they invested heavily in the solution proposed. This experience underscores the importance of understanding the different budget allocations within the customer’s organisation.
Business Outcome – How
The second component involves determining the business outcomes the customer aims to achieve. This could involve acquiring new customers, increasing sales from existing customers, or enhancing process efficiency. If growth is the objective, strategies may include acquiring new customers or boosting sales from current ones.
Key Performance Indicators – If
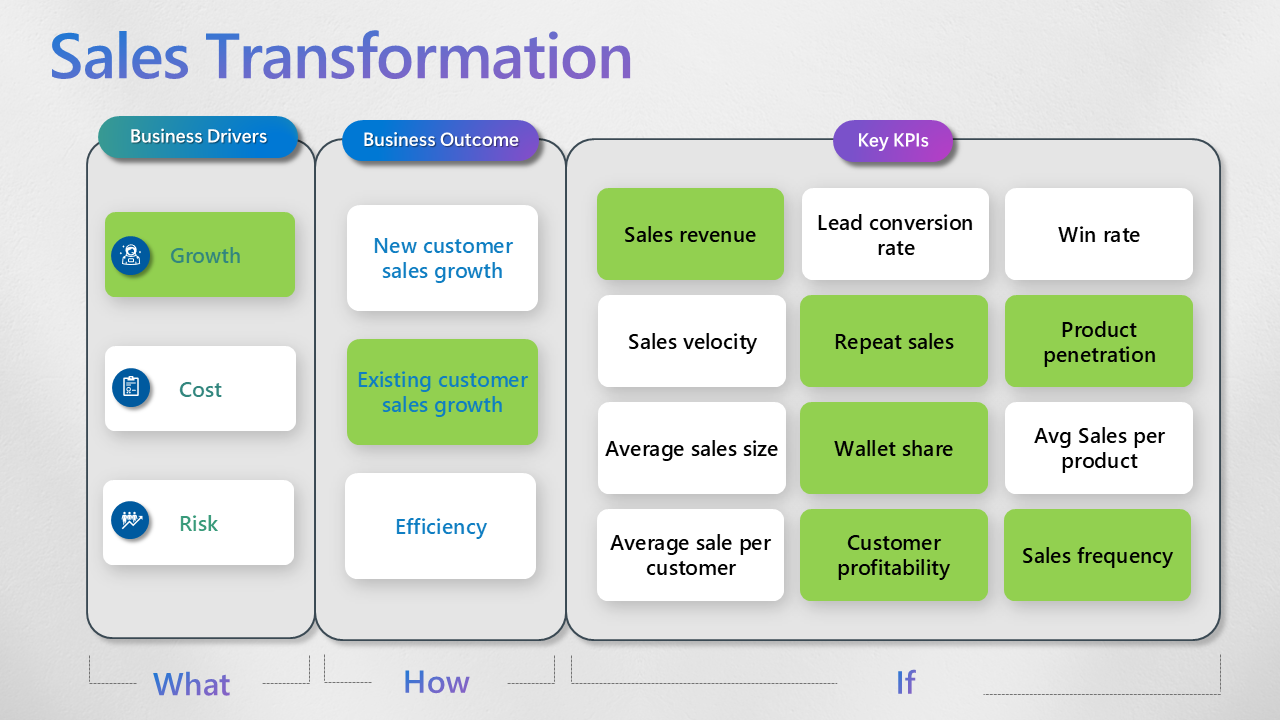
To measure success, key performance indicators (KPIs) are used. For new customer sales growth, metrics such as sales revenue, sales velocity, and lead conversion rates are essential. Instead, for existing customer growth, indicators like average order size, repeat sales, and product penetration are critical. Each metric provides valuable insights and requires tailored language, storytelling, and value propositions.
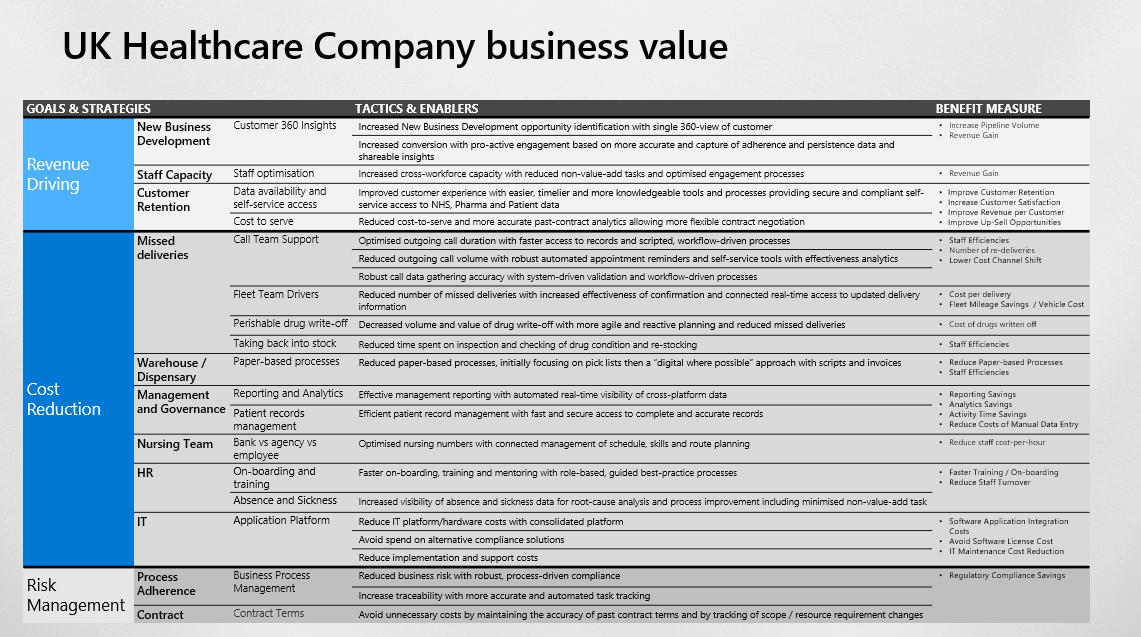
The image below is an example framework completed with a sample made up customer. It is taken from our Catalyst program which you can find links to at the end of this post.
When I first starting doing this many years ago I used to carry a a PDF around with me that contained a library of KPIs and definitions. Today I rely on Copilot:
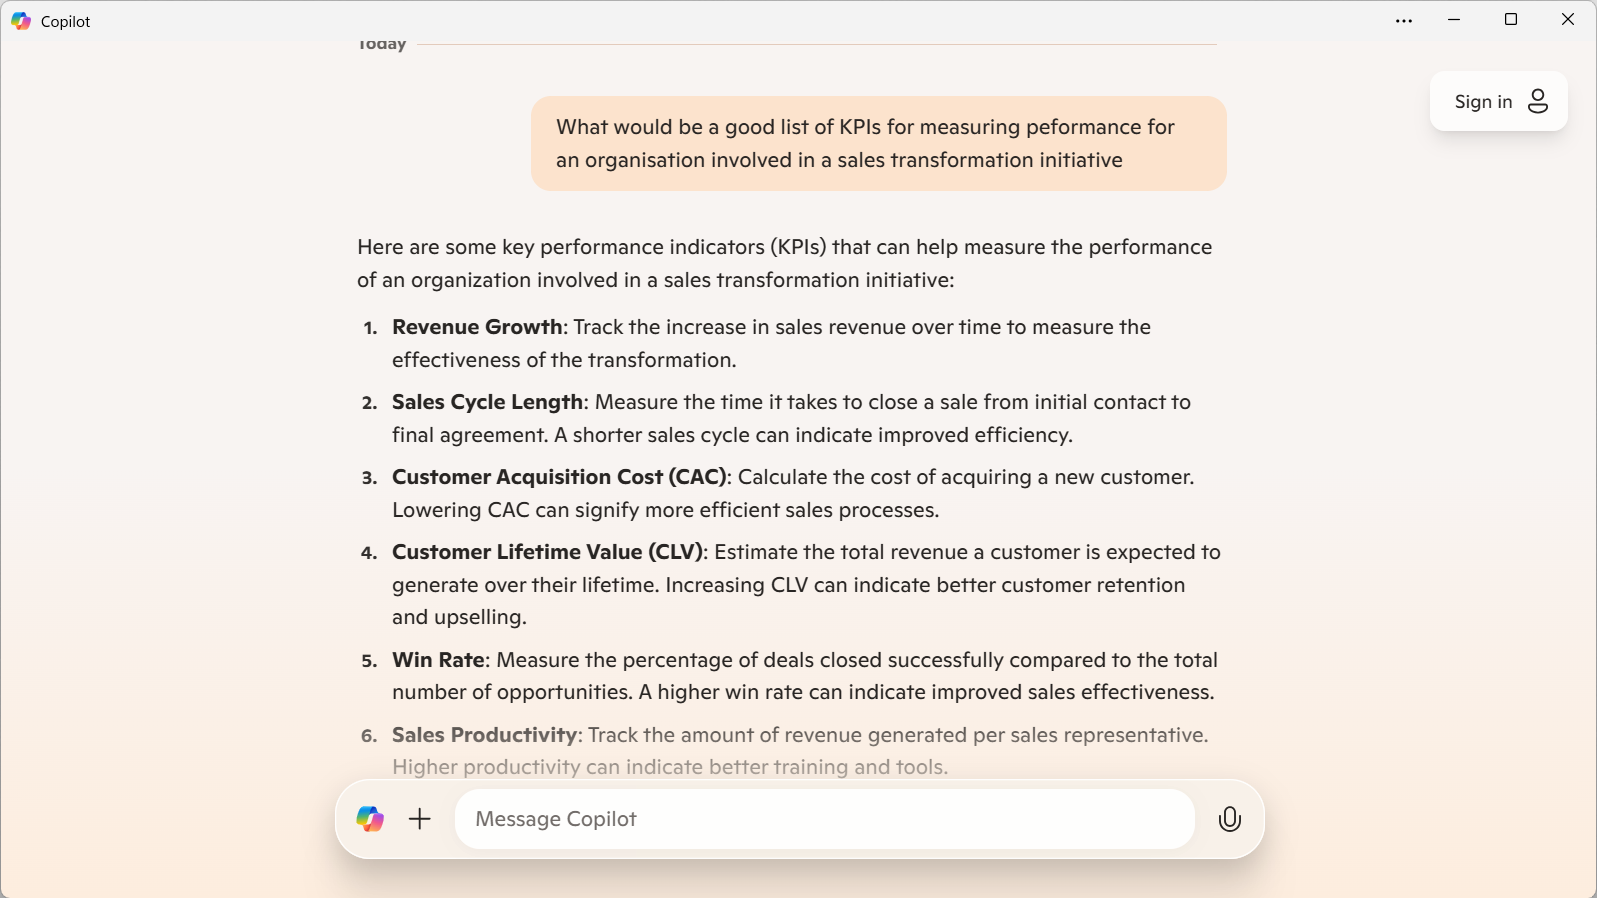
A further refinement of the prompt can help you build a more customised framework for your solution:
Business Drivers
- Market Expansion: Entering new geographic regions or customer segments.
- Customer Experience: Enhancing customer satisfaction and loyalty.
- Operational Efficiency: Streamlining processes and reducing costs.
- Digital Transformation: Leveraging technology to improve sales processes.
- Competitive Advantage: Differentiating from competitors through unique offerings.
- Revenue Growth: Increasing sales through cross-selling, upselling, and new product launches.
Business Outcomes
- Increased Market Share: Capturing a larger portion of the market.
- Higher Customer Retention Rates: Reducing churn and increasing repeat business.
- Improved Sales Productivity: Achieving more sales with the same or fewer resources.
- Enhanced Customer Satisfaction: Receiving higher customer satisfaction scores.
- Faster Sales Cycles: Reducing the time it takes to close deals.
- Revenue Growth: Achieving higher sales and revenue targets.
Key Performance Indicators (KPIs)
- Sales Growth: Percentage increase in sales revenue.
- Customer Acquisition Cost (CAC): The cost of acquiring a new customer.
- Customer Lifetime Value (CLV): The total revenue expected from a customer over their lifetime.
- Churn Rate: The percentage of customers who stop doing business with the company.
- Average Deal Size: The average value of closed deals.
- Sales Cycle Length: The average time it takes to close a deal.
- Conversion Rate: The percentage of leads that convert into customers.
- Net Promoter Score (NPS): A measure of customer satisfaction and loyalty.
You can also ask Copilot for example industry benchmarks:

Sales Growth
- Industry Benchmark: Sales growth rates can vary significantly by industry. For example, technology companies often aim for annual sales growth rates of 15-25%, while more mature industries like manufacturing might target 5-10%[1].
Customer Acquisition Rate
- Industry Benchmark: The cost of acquiring a new customer (Customer Acquisition Cost – CAC) can vary widely. For instance, in the B2B sector, the CAC can range from $164 to $310[2]. The visitor-to-lead conversion rate is typically around 2.2%[3].
Customer Retention Rate
- Industry Benchmark: Customer retention rates also vary by industry. For example, the banking industry enjoys a relatively high average retention rate of around 75%, while the hospitality industry has a lower average retention rate of about 55%[4].
Sales Cycle Length
- Industry Benchmark: The average sales cycle length can differ based on the complexity of the product and the industry. For example, in the software industry, the average sales cycle length is around 90 days, while in the manufacturing industry, it can be around 130 days[5].
Lead Conversion Rate
- Industry Benchmark: The lead conversion rate varies by the type of lead. For cold leads, the conversion rate is typically 1-3%, for warm leads it is 5-10%, and for highly targeted leads from existing customers, it can be 10-25%[2].
Customer Satisfaction Score (CSAT)
- Industry Benchmark: Customer satisfaction scores (CSAT) generally range from 75% to 80% across various industries[6].
Sales Team Productivity
- Industry Benchmark: Sales team productivity can be measured by various metrics such as the number of deals closed per salesperson, revenue generated per salesperson, and the average deal size. For instance, achieving more sales with the same or fewer resources is a common benchmark[7].
And of course, please always check the citations
Further reading:
If you want to find out more about Value Engineering and the Catalyst Program (and I highly recommend it) you can find a comprehensive training program here: https://get365ready.com/microsoft-level-up/course-detail/1360820 and here:https://partner.microsoft.com/en-US/asset/collection/microsoft-catalyst-partner-presales-immersion-course#/
Download:
Thank you for reading!
